Hotline |
ICDs |
Build Status |
Build Loaded |
Wind Farms |
Mod/SW Notes |
RMT Status |
Radar Operations Center
How Wind Turbines Impact the WSR-88D
Tall structures, such as wind turbines, can have a variety of impacts on WSR-88Ds. Wind turbines have the added challenge of being almost constantly in motion with the rotating blades. These targets can show up in radar base data, algorithms, and derived products when within the Radar Line of Sight (RLOS). Additionally, if the structure is situated very close to the radar, it could be a concern for equipment and personnel safety.
Radar Line of Site and Beam Blockage
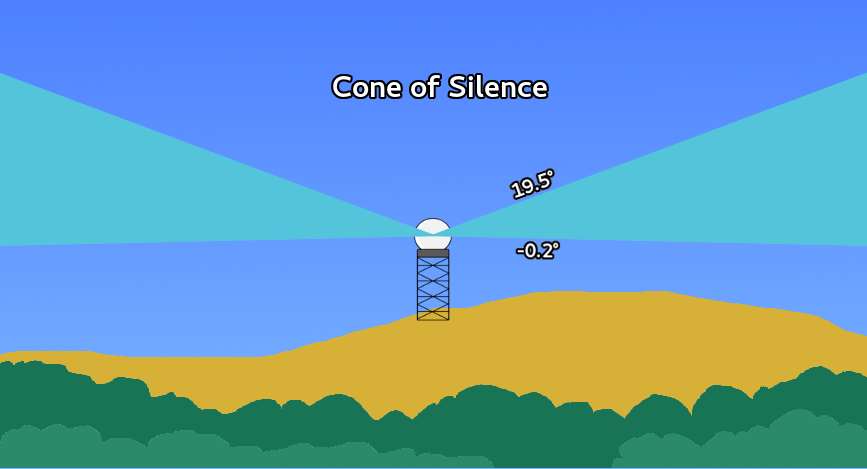
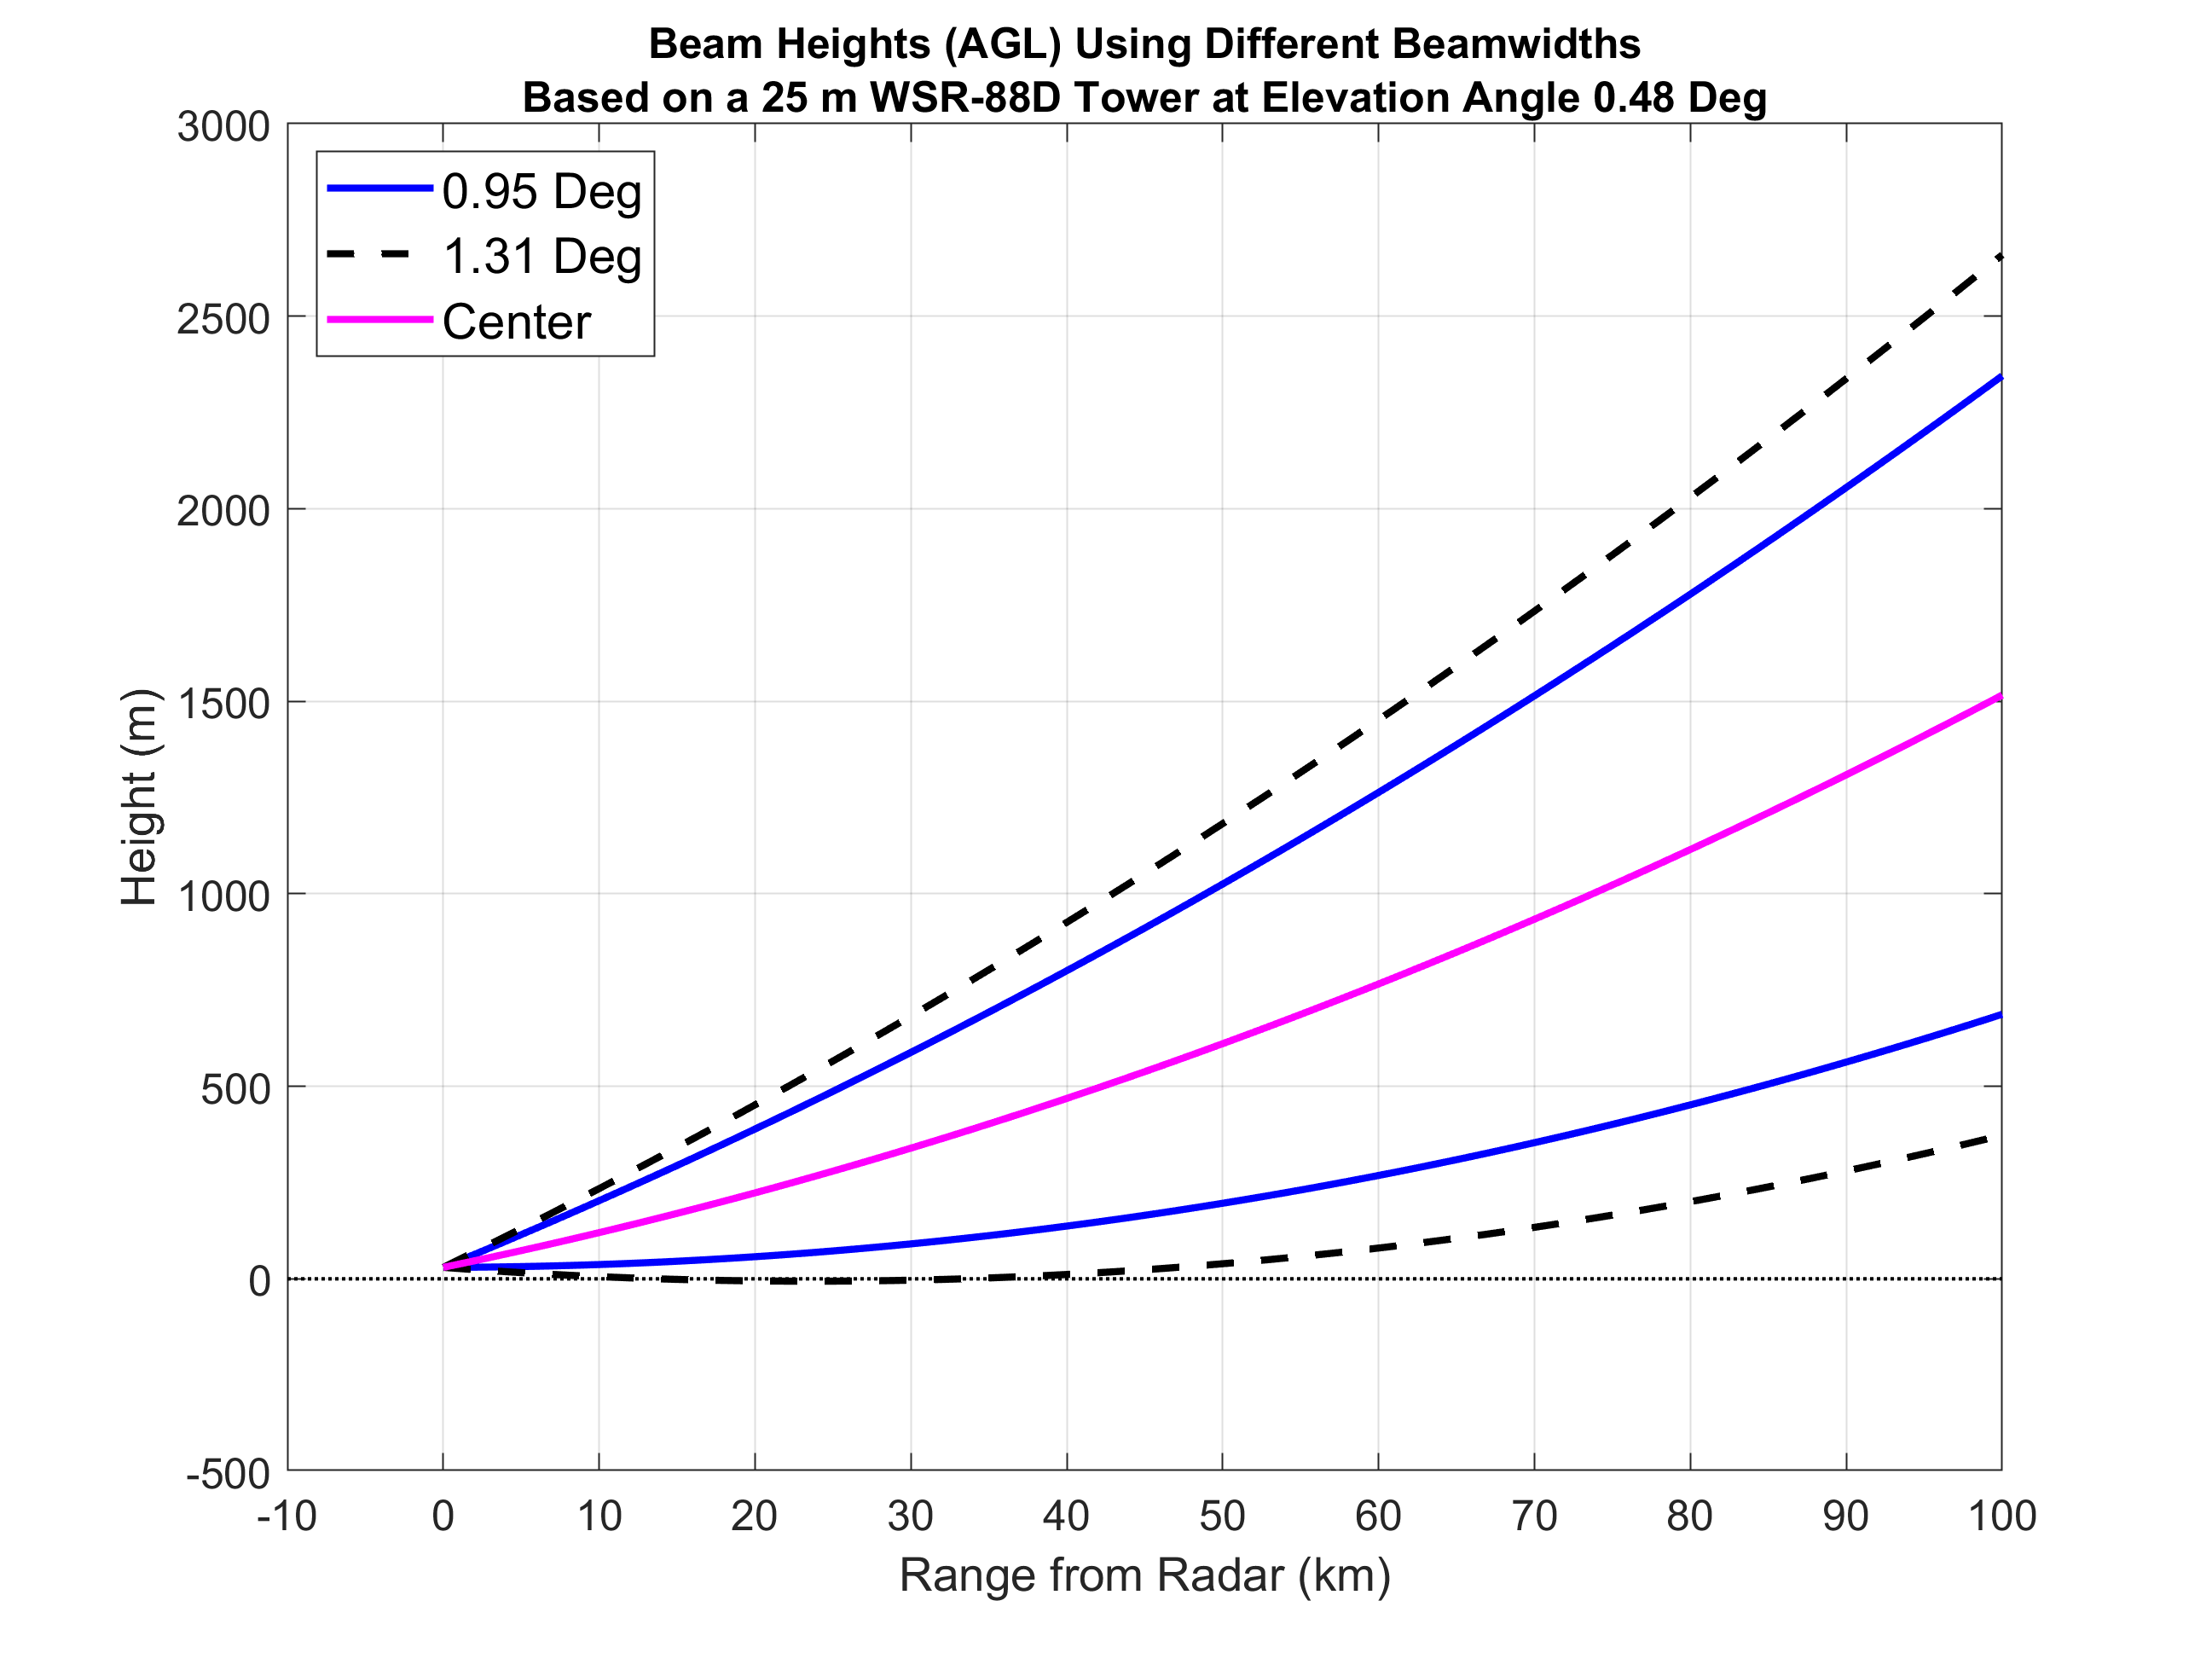
The WSR-88D performs 360-degree sweeps at specific elevation angles between -0.2 and +19.5 deg to scan the atmosphere for weather. Because most elevation angles are positive (e.g., 0.5 degrees and up), the radar beam center location increases with height as it moves downrange. The curvature of the earth also places a straight-line beam at a higher altitude at far ranges. Though the beam is increasing in height, it also broadens its diameter as it goes out. The Beam Bottom and Beam Top are defined as the points where there is a 50% reduction in transmitted energy. Anything between the Beam Bottom and Beam Top is referred to as the “beam” - currently, the WSR-88D uses a beamwidth of approximately 1 degree, aka the half-power beamwidth. Anything within the “beam” can transmit energy back to the radar. Although transmitted energy drastically decreases below/above the Bottom/Top, it does not become negligible.
Targets outside the half-power beamwidth can still reflect energy back to the radar. This is most noticeable between the half-power beamwidth and the first null beamwidth, which falls at around 1.3 degrees. Thus, 1.3 degrees can be considered the “effective” beamwidth. Highly reflective targets within the “effective beam” also transmit energy back to the radar. In both cases, more energy can be reflected back if the target is closer to the radar.
|
| Figure 1: Illustration of the elevation angle range used for weather detection. |
|
| Figure 2: Illustration of a radar beam and its broadening effects in range, as well as the effective beam width. |
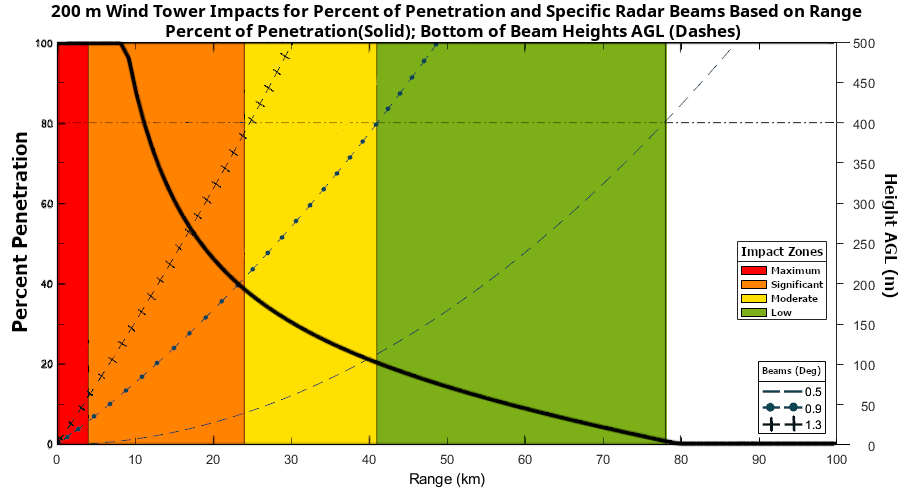
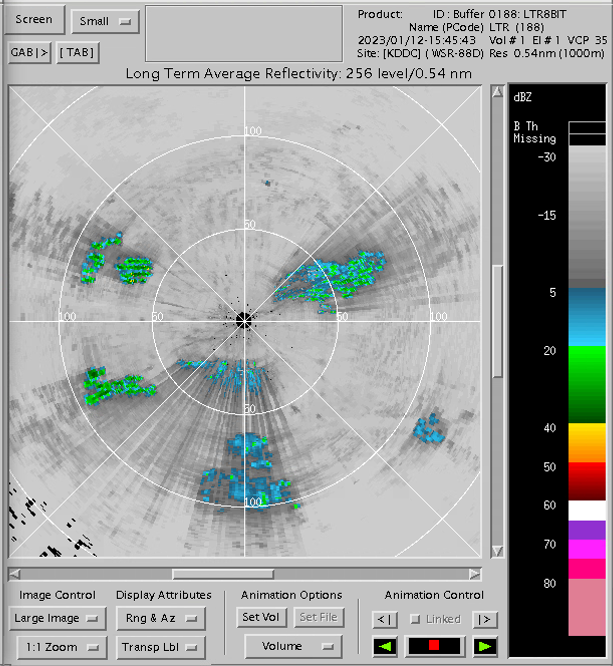
If a structure is sited close to a radar, it can partially or fully block the radar beam. This blockage attenuates energy down range of the structure, which causes shadows or spikes in the data. Complete blockage means no returns can be detected at any point down range from the structure to the full radar detection range (460 km for Reflectivity detection and 300 km for Doppler and Dual-Pol detection). Taller and closer structures can impact multiple elevation angles. There is reduced impact if a structure is below the Beam Bottom height.
|
| Figure 3: Example of blockage impacts from a 200 m turbine at specific elevation angles. |
|
| Figure 4: Long Term Average Reflectivity (LTAR) example showing strong returns and down-radial shadow effects from wind farms near KDDC (Dodge City, KS). |
Radar Line of Site and Beam Blockage
The WSR-88D has a very sensitive receiver designed specifically for detection of weather. There is a Receiver Protector to prevent damage from strong signal returns from more solid targets, such as planes or buildings, but the protection upper limit is 53 dBm. Large objects situated close to the radar (< 4 km) have the potential to reflect signals above this limit and damage the receiver, rendering the radar inoperable.
Additionally, the WSR-88D emits a strong signal. Equipment that is too close to the radar (< 4 km) could be damaged. When turbines are sited within 200 m, construction or maintenance personnel may be exposed to microwave energy exceeding Occupational Safety and Health Administration (OSHA) thresholds. This number assumes a Standard Atmosphere Index of Refraction profile and level terrain, so impacts could occur closer or further away than the 200 m range. Accurate determination of the RLOS and impact distances requires a detailed site-by-site analysis.
Radar Data Impacts
Energy reflected back to the radar is captured by the Receiver and then calculated into the base moments of reflectivity, velocity, and spectrum width, along with the Dual-Polarimetric variables of differential reflectivity, correlation coefficient, and differential phase. These Base Data products (known as Level II) are used by forecasters and consumers to visually detect specific signatures. They are also used as input to algorithms and models that create derived products such as precipitation estimation or tornado/rotation detection products.
Any non-weather signal return is considered “clutter” for WSR-88D interpretation. The WSR-88D uses sophisticated clutter detection and filtering schemes focused on stationary targets such as buildings or terrain. Wind turbines pose a challenge because the rotating blades look like a moving target similar to weather. This is particularly challenging when the returns are strong and look similar to precipitation. It can be visually difficult to determine if a storm is intensifying over a wind farm, and the returns can inadvertently add to products such as precipitation estimation totals.
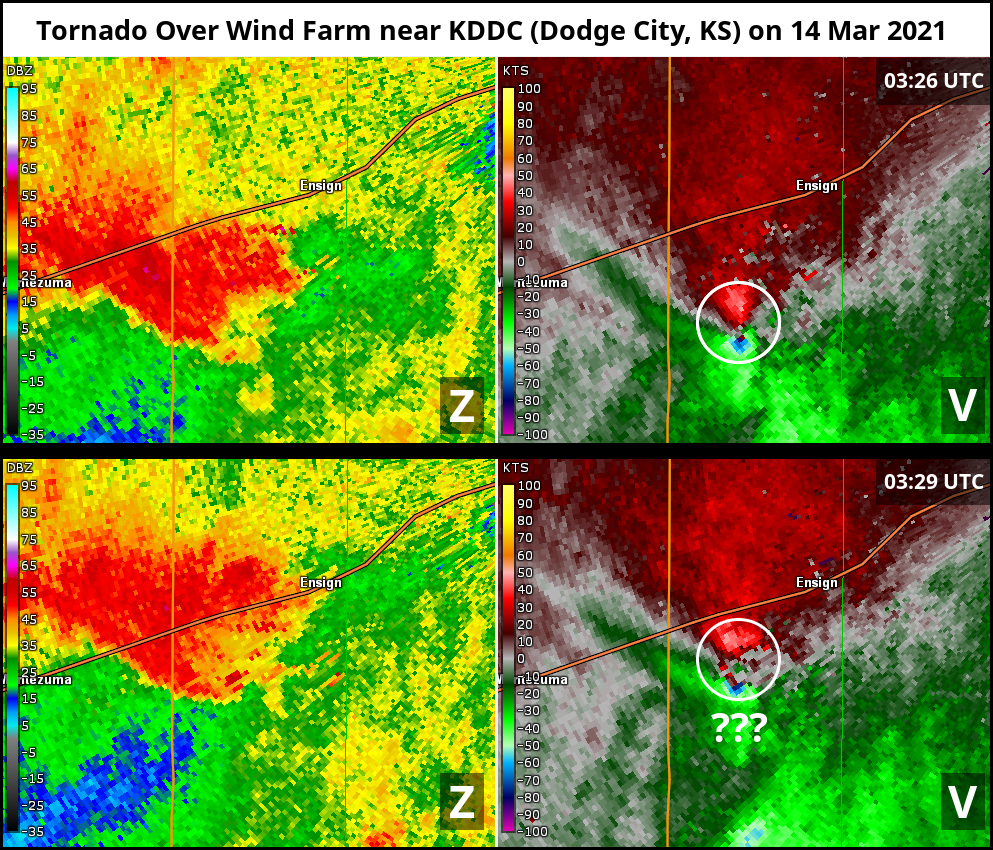
|
| Figure 5: Example of a tornadic supercell near KDDC (Dodge City, KS) on 14 Mar 2021. The circulation is clearly visible (top) until it moves over an area with wind turbine clutter (bottom). The signature becomes obscured in both reflectivity (left) and velocity (right). |
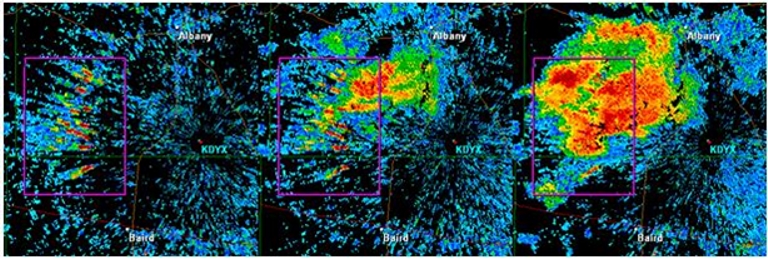
|
| Figure 6: Sequence (left to right) of 0.5 deg reflectivity images showing thunderstorms developing over a wind farm (purple rectangle) 18-30 km (10-16 nm) west of KDYX (Dyess AFB, TX) from 02 Jun 2009. Left: Thunderstorms have not yet developed; high reflectivity values due to wind turbines alone. Middle: Storm developing. Right: Storm appears to have developed a distinct notch structure, which is indicative of severe weather, but the wind turbine clutter interferes with clear interpretation. |
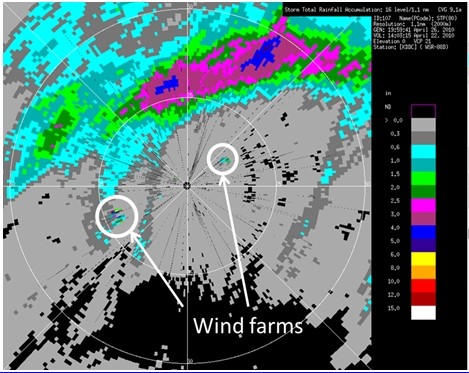
|
| Figure 7: This radar-estimated Storm Total Precipitation accumulation product from KDDC (Dodge City, Kansas) on 22 Apr 2010 at 14:03 UTC depicts how wind farms can impact radar-derived products. Erroneous 4+ inch radar-estimated Storm Total Precipitation accumulations (indicated by the arrows) are due to wind farms northeast and southwest of the WSR-88D. The anomalous accumulations make estimates of rainfall over an area/river basin more difficult to determine. |


